One Algo Trading Platform. Built for Traders, Advisors & Enterprises.
Whether you're a Retail Trader, Quant Developer, RA/RIA, Broking House, or a Fintech firm—AlgoBulls gives you the tools, infrastructure, and compliance to build, deploy, and scale algorithmic strategies with ease - without servers, delays, or complexity.
💡 Whether you're looking to automate your own trades or offer algo solutions to your existing user base at any scale — we have end-to-end solutions tailored for you.
- AlgoBulls Overview
- Odyssey Overview
- Phoenix Overview
Who is algobulls for?

Retail Traders & Investors
Trade smarter using ready-made strategies, create your own using forms/AI, or let experts build it for you —no code needed.
Explore Solutions for Retail Traders
Quant Developers & Coders
Code in Python. Use Jupyter Notebooks, CLI, ML libraries, and deploy live—without managing servers.
Explore Solutions for Developers
Strategy Creators
Whether you're a Research Analyst, trader, or quant — share your logic and get your strategy built, deployed, and monetised on our platform.
Explore Solutions for Creators
Broking Houses & Fintech Firms
Launch your own white-labeled algo trading desk. Scalable, compliant, and deployment-ready.
Explore Solutions for Enterprises
Hedge Funds, RIAs & Asset Managers
Automate portfolio strategies, reduce manual execution risk, and offer enhanced execution algos to clients under your own brand.
Explore Solutions for Enterprises
Proprietary & Quantitative Trading Desks
Deploy proprietary models securely using our infra. Scale execution with full control, zero infra burden, and real-time analytics.
Explore Solutions for EnterprisesWhat Sets us apart?
AI + Full Code + No-Code Strategy Building
Phoenix Suite for everyone to create your custom strategy with maximum flexibility and choice.
Machine Learning Strategy Support
Use libraries like scikit-learn, TensorFlow to build advanced predictive algos through Python Build.
SEBI-Compliant Infrastructure
Our strategy onboarding, documentation, and RA partner workflows are designed in line with SEBI’s regulations.
Enterprise-Ready Infra
Scalable backend, white-label dashboards, RA management tools, and API support to serve 10 or 10,000 clients.
Ready-to-Use, No DevOps Needed
Fully cloud-managed. Just build and deploy. You take care of your strategy while we take care of the entire tech for you.
External Signal Integrations
Execute your strategies by taking signals from TradingView, Chartink, Excel, APIs or your existing setup.
Backtesting, Paper & Live Trading
All mode of executions from one platform without changing a single line of code.
AlgoBuddy Support
AI chatbot trained on user queries and expert insights to help you algo trade effortlessly.
What You Can Use?
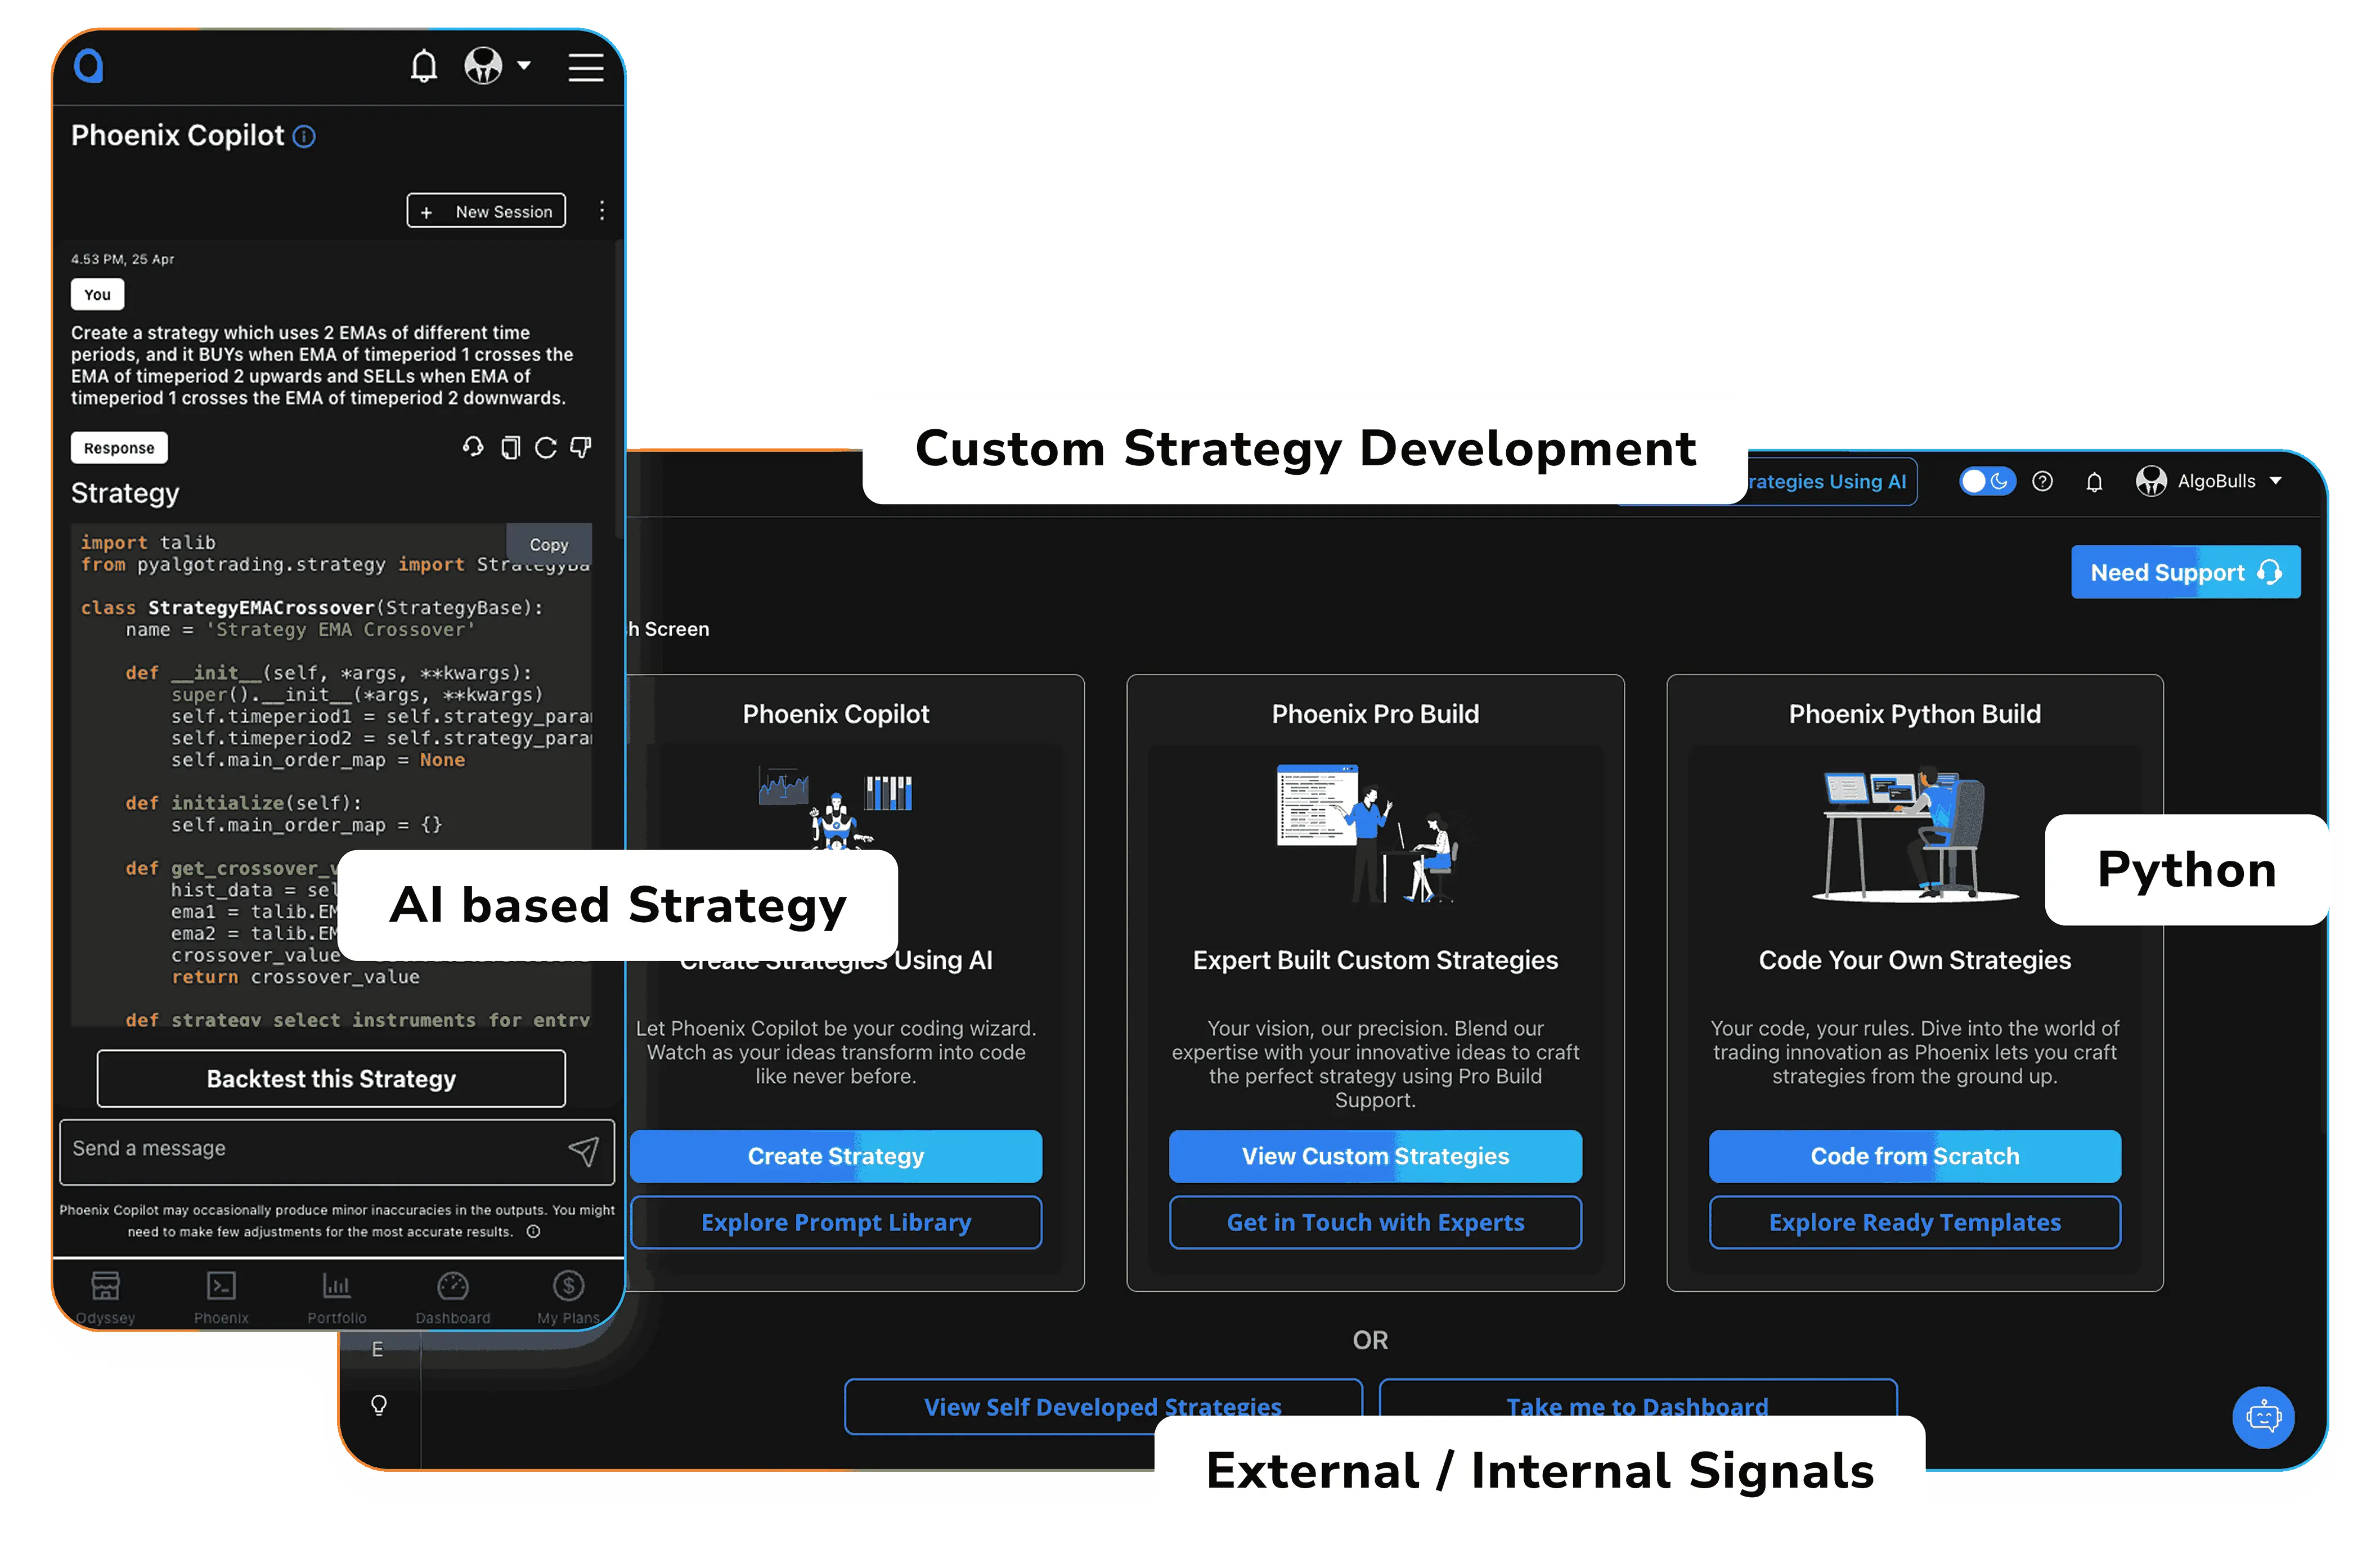
PHOENIX – Strategy Building, Your Way
With Phoenix, you can build strategies using:
- Copilot (AI Builder) – Just describe your idea in English to generate your strategy code
- Classic Build (No-Code) – Use dropdowns or AI to create and test logics instantly
- Pro Build (We Build for You) – Share your logic, we develop it end-to-end for you to algotrade efficiently
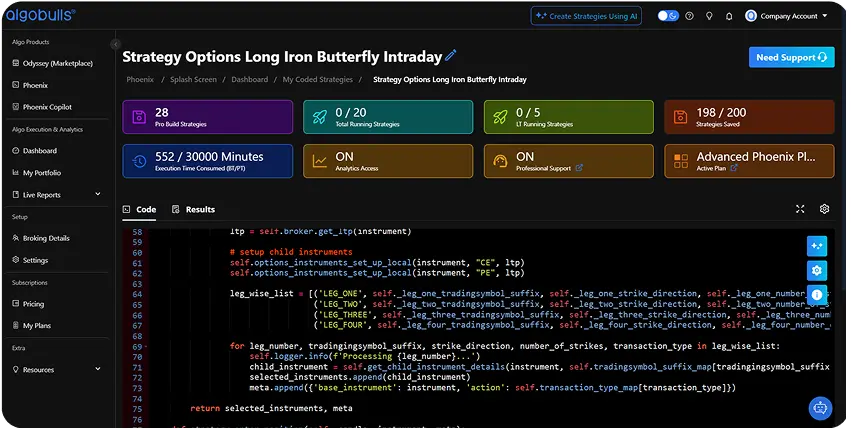
- Python Build (Code It Yourself) – For quants and developers who prefer to have the flexibility of coding their strategies
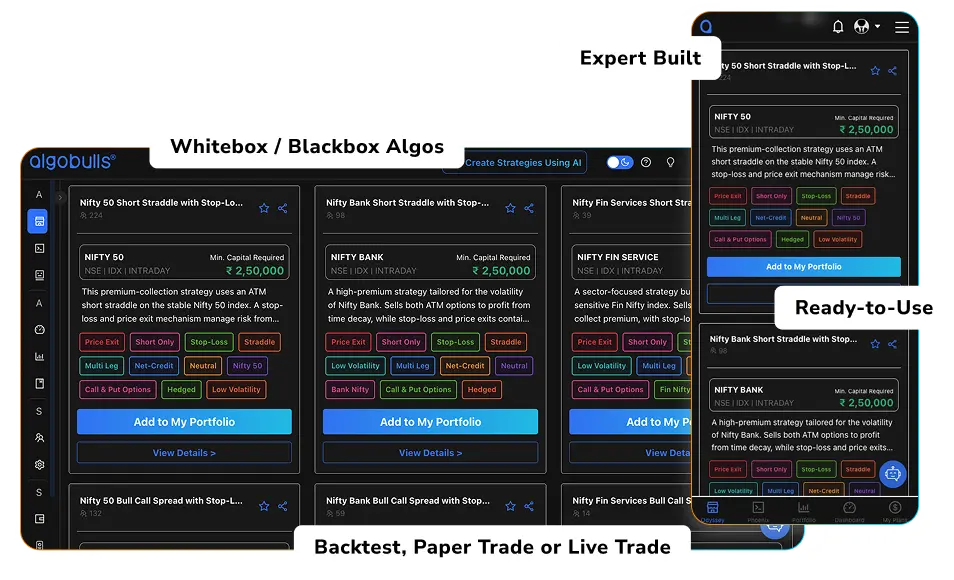
ODYSSEY – Choose from a range of expert curated strategies
With Odyssey, you can:
- Choose Whitebox Algos – Ready-made strategies created by expert strategists and logics openly shared for better decision making.
- List your strategies as a Strategy Creator – As a Strategy Creator, you can share your strategies on Odyssey for the world to use.
💬 Have a question? Ask AlgoBuddy — Your Smart Algo Assistant
Our AI-powered chat bot can help you with:
- Choosing the right product
- Understanding platform features
- Clarifying strategy-building steps
- Live help—24/7
Try Phoenix Copilot Now - No Login Required !
Experience the future of Algo Trading. It's easy to get started. Chat with our AI now and backtest your first trading idea 👇
Features that matter

100% Automation
No manual execution. Your logic, fully automated.

AI & ML Strategy Capabilities
Just type your idea. Our AI builds your strategy.

Backtesting & Paper Trading
Test with historical and live market data.

Enterprise-Grade Security
Your data and assets protected by industry-leading security protocols.

Zero Infra Maintenance
Focus on trading while we handle all infrastructure and platform maintenance.

Multi-Strategy Support
Run multiple trading strategies simultaneously across different assets and timeframes.

Full Analytics & Trade Logs
Comprehensive insights into your trading performance with detailed logs and metrics.

TradingView / Chartink / API Signal Integration
Seamlessly connect with popular trading platforms and data providers.
Want to Launch Your Own Algo Desk or Client Execution Platform?
We offer a full-stack enterprise solution for:

Broking Houses
Increase trading volume, client retention

RA & PMS Firms
Automate and distribute research-based strategies

Fintech Platforms
Embed or integrate algo infra via APIs or SDKs

White-Labeled Solutions
Offer AlgoBulls under your own brand

Multi-User Management
Capital control, access roles, live logs
TRUST & COMPLIANCE

SEBI-Aligned Framework
We follow regulatory standards across onboarding, documentation, RA collaborations, and risk management.

Compliance-Ready Workflows
From disclaimers to logs, every component is built for auditability and transparency.

Trusted by Industry Leaders
Used by Registered Advisors, SEBI-Registered Analysts, and Broker Partners.
$1+ Billion
Live Trading Volume
1+ Million
Live Orders
1K+
Direct Clients
1M+
Clients Across Enterprises
1+
Supported Broking Houses
1+
OMS Vendors Supported
Testimonials
Don’t just take our words for it
“AlgoBulls helped us launch our own algo platform under our brand in under 30 days.”

“Our research team now delivers live algos to clients with zero manual intervention.”

“I built and deployed my first Python strategy without worrying about infra or brokers.”
And, the Media Mentions & Awards


Our Achievements
A Legacy of Trust and Performance
The Best Algo Trading Platform – 100% Regulatory Compliance for Secure & Hassle-Free Trading


"Winner, Emerge 50 Awards"
NASSCOM, 2024

"Best Automated Trading Software"
Runner-up, Benzinga Fintech Awards 2024
"Fintech Startup of the Year"
Finalist, India Fintech Awards 2024
"Best Paper Trading Platform"
Finalist, Benzinga Fintech Awards 2024


