Introduction
Did you know that more than 70% of successful traders swear by technical analysis to sharpen their trading strategies? Whether you’re stepping into the trading arena for the first time or looking to polish your existing skills, mastering a few key technical analysis techniques can really elevate your game. In this article, we'll stroll through five popular techniques—Heikin Ashi, EMA, RSI, MACD, and Bollinger Bands. These tools will help you spot trends, catch reversals, and measure market momentum, giving you the insights you need to make smarter trading choices. Ready to dive in and enhance your market edge? Let’s get started!
Heikin Ashi Candlestick Pattern (HACP)
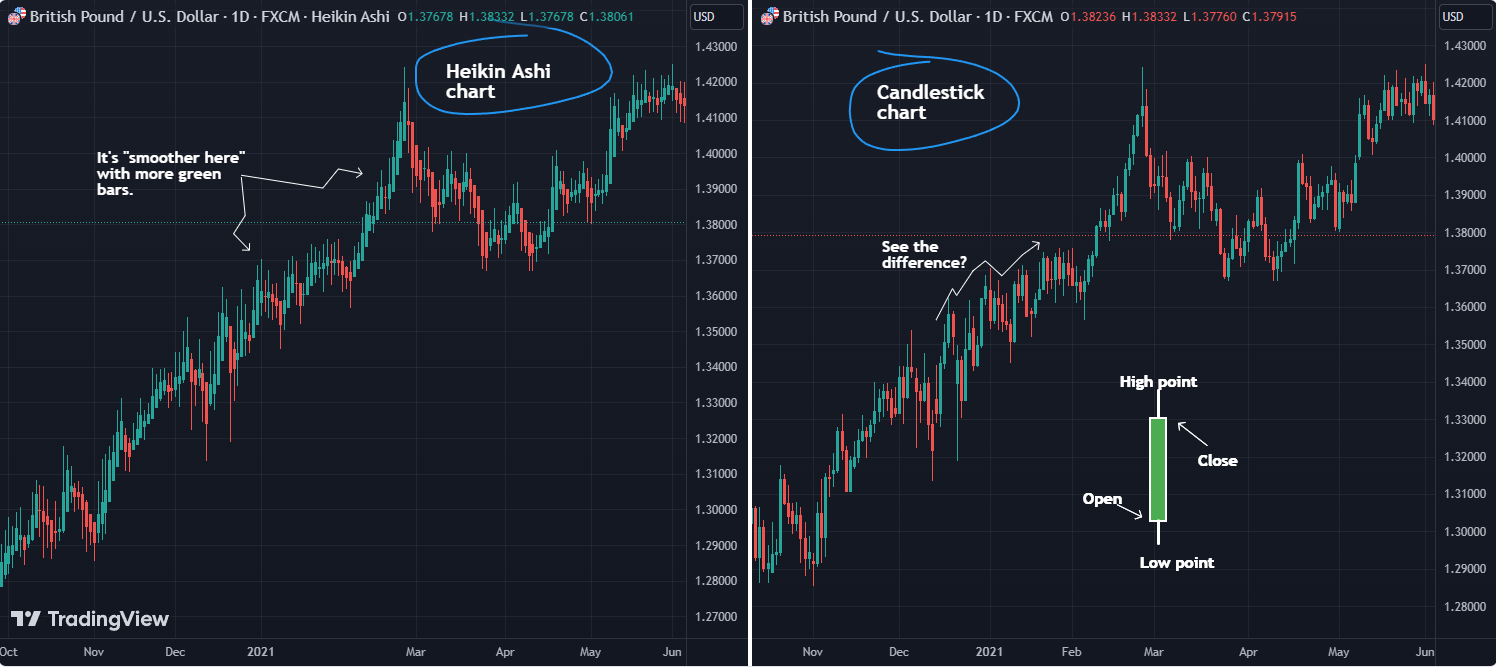
Heikin Ashi charts offer a refreshing take on analyzing market trends by smoothing out the noise. Unlike traditional Candlestick Charts (CC) that show precise price levels (open, close, high, low), Heikin Ashi charts focus on average prices over time, making it easier to spot trends without getting lost in daily price fluctuations.
Key Differences Between Heikin Ashi and Candlestick Charts:

- Candlestick Charts (CC) lay out the highs, lows, opens, and closes for each time period, often presenting a whirlwind of price movements.
- Heikin Ashi Charts (HAC), however, smooth out those fluctuations, revealing clearer trends. This makes them perfect for traders focusing on long-term trends.
Heikin Ashi Formula:
- Open = (Previous bar open + Previous bar close) / 2
- Close = (Open + High + Low + Close) / 4
- High = Highest value from open, high, low, or close
- Low = Lowest value from open, high, low, or close
Use Case:
Heikin Ashi charts are your go-to for spotting clearer trends, especially if you want to filter out short-term noise. Just remember, they’re not the best for backtesting strategies or executing trade orders since their prices aren’t based on actual bid/ask levels.
Exponential Moving Average (EMA)
The Exponential Moving Average (EMA) is a powerful tool that gives more weight to recent price data, making it more responsive to current market conditions compared to a Simple Moving Average (SMA). This makes it a great ally for traders reacting to short-term price changes.
Key Takeaways:
- The EMA puts more emphasis on recent data points.
- Traders often use it to generate buy and sell signals based on crossovers (when shorter EMAs cross longer ones).
Formula for EMA:
EMA = (ValueToday × 2 / (Days + 1)) + (EMAYesterday × (1 - 2 / (Days + 1)))
For a 20-day EMA, the multiplier comes out to 0.0952, giving more weight to the most recent price.
Use Case:
Because EMAs are more sensitive to price changes, they’re fantastic for traders in fast-paced markets. Day traders might lean on EMAs to catch short-term trends, while long-term investors often look at the 50-day and 200-day EMAs to identify broader market trends.
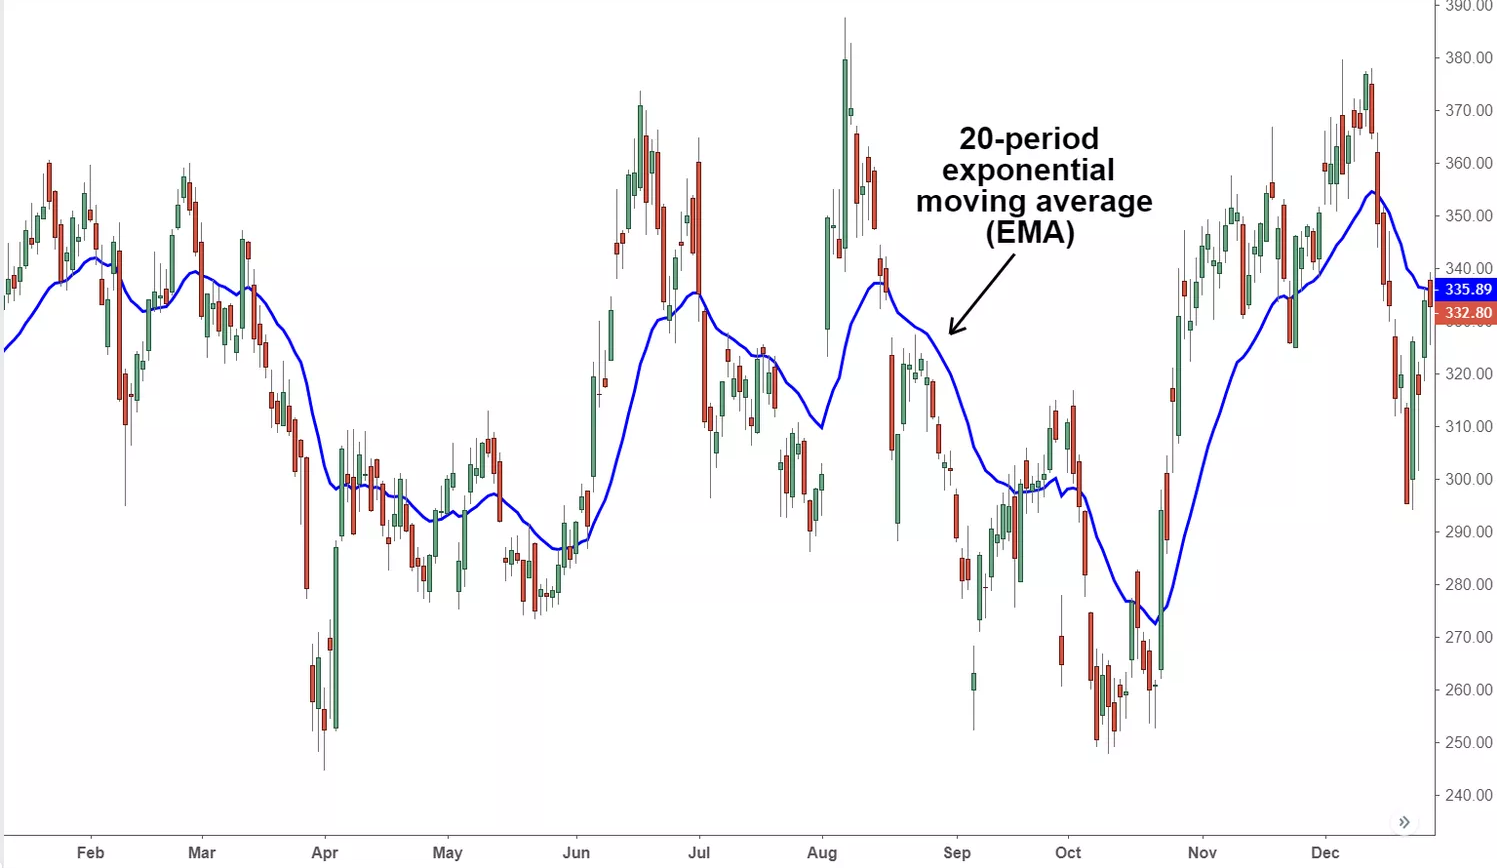
Source - TradingView
Relative Strength Index (RSI)
The Relative Strength Index (RSI) is a handy technical indicator that helps traders assess momentum and pinpoint potential overbought or oversold conditions in a security's price. Let’s break down the essentials of RSI, including how it’s calculated and what it means for your trading strategies.
Understanding RSI: What it Measures
The RSI is a momentum oscillator ranging from 0 to 100, created by J. Welles Wilder Jr. It measures how fast and how much recent prices have changed, signaling potential turning points in the market.
Key Takeaways:
- Overbought and Oversold Signals: If the RSI climbs above 70, it might suggest overbought conditions, while dipping below 30 can indicate oversold conditions.
- Availability: You’ll find RSI on just about every online trading platform.
How RSI Works: Calculation Steps
- Average Gain vs. Average Loss: The RSI compares average gains on days when prices went up to average losses on days when they fell over a set period (usually 14 days).
Formula:
RSI = 100 - [100 / (1 + (Average Gain / Average Loss))]
- Smoothing the Results: This step helps reduce volatility in initial calculations, preventing extreme readings in trending markets.
Formula:
RSI = 100 - [1 + (Previous Average Loss × 13 + Current Loss) / (Previous Average Gain × 13 + Current Gain)] × 100
Interpreting RSI Readings
- Trends and Levels: During an uptrend, you might see oversold readings above 30, while in a downtrend, readings can linger below 70.
Divergences:
- Bullish Divergence: If the RSI is oversold and forms a higher low while the price hits lower lows, this could signal potential bullish momentum.
- Bearish Divergence: If the RSI shows overbought conditions with a lower high while the price makes higher highs, it might indicate weakening momentum.
Potential Reversal Signals
- Positive RSI Reversal: If the RSI hits a lower low while price makes a higher low, this could signal a bullish trend reversal.
- Negative RSI Reversal: If the RSI makes a higher high while price forms a lower high, it could indicate a bearish trend reversal.

Moving Average Convergence Divergence (MACD)
The Moving Average Convergence Divergence (MACD) is an essential indicator created by Gerald Appel back in 1977. It’s a fantastic tool that helps traders identify trends and spot potential market reversals by visually representing price movements and market volatility.
How MACD Works
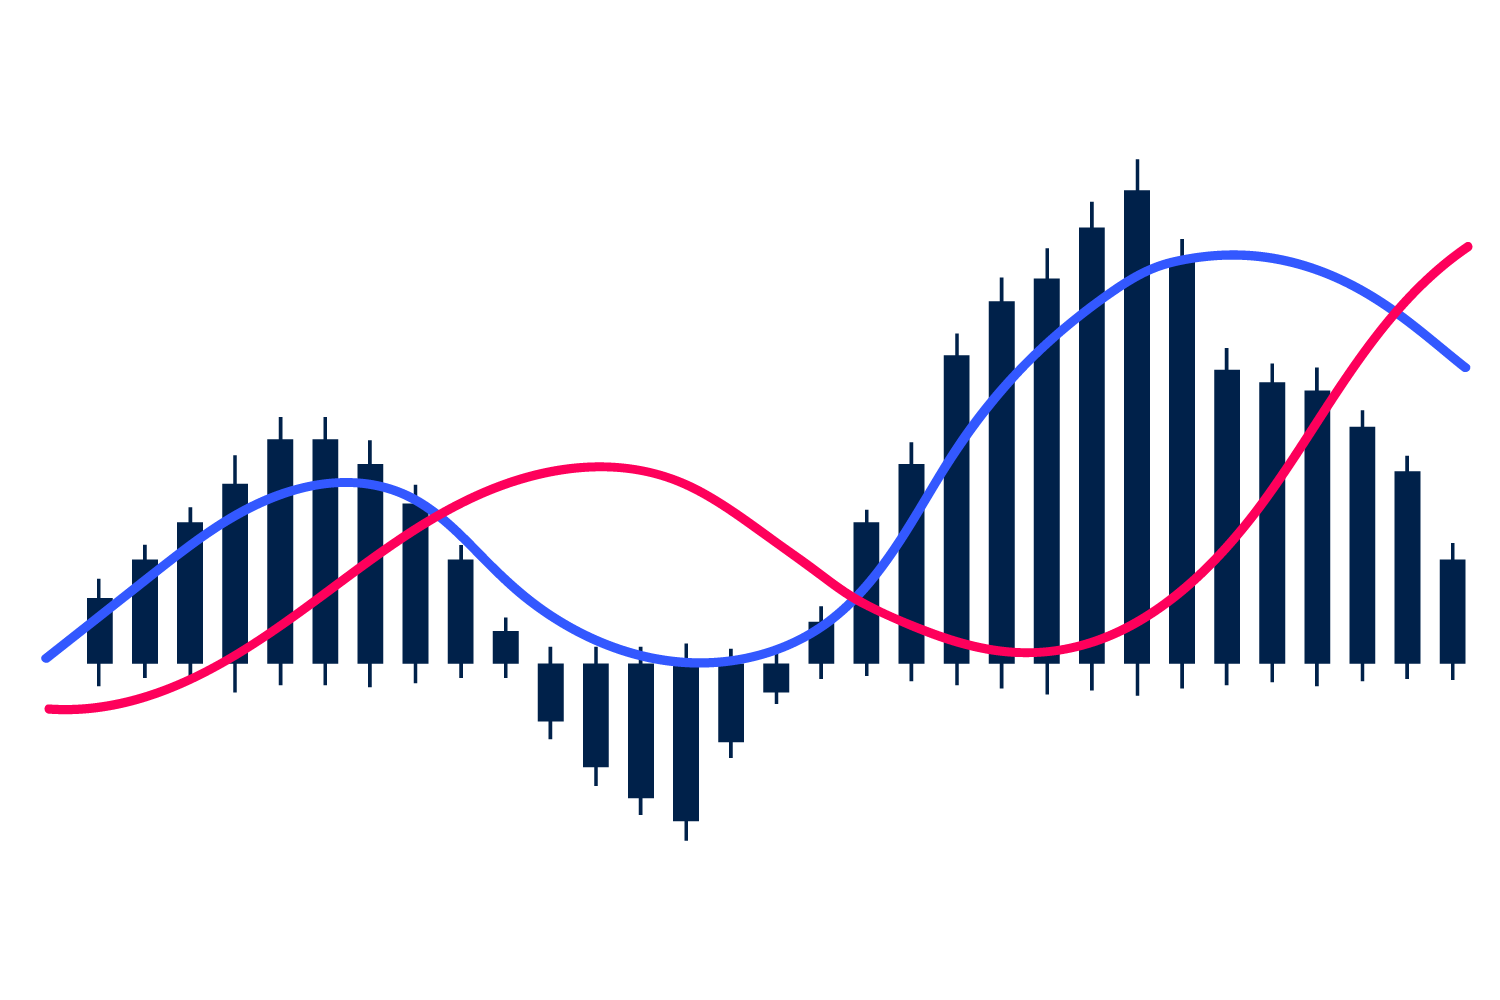
MACD features two main lines that oscillate above and below a zero line:
- MACD Line (Blue): This is calculated by subtracting the 26-period exponential moving average (EMA) from the 12-period EMA.
- Signal Line: A 9-period EMA of the MACD line. The histogram that accompanies these lines shows the strength of price movements, helping traders gauge momentum.
Using MACD for Trading
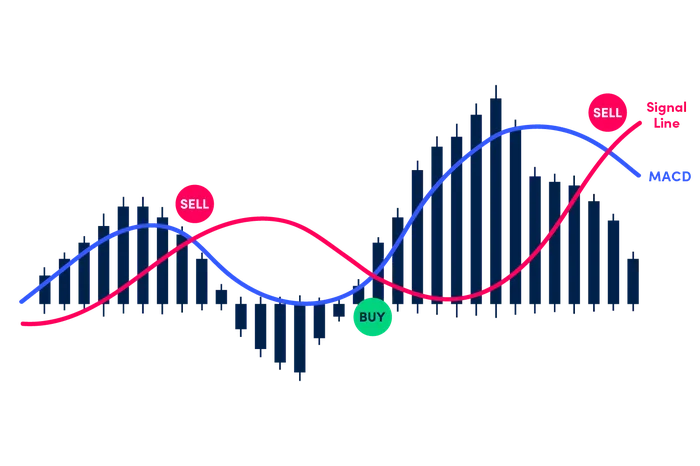
Traders often look at crossovers between the MACD line and signal line as potential entry or exit points:
- Buy Signal: When the MACD line crosses above the signal line.
- Sell Signal: When it crosses below.
But a word of caution: relying solely on MACD can lead to false signals. It’s wise to confirm signals with other technical analysis tools, like support and resistance levels.
Calculation:
The MACD is calculated by subtracting a longer-term EMA from a shorter-term EMA, with a signal line created using a shorter-term EMA of the MACD line.
Bollinger Bands
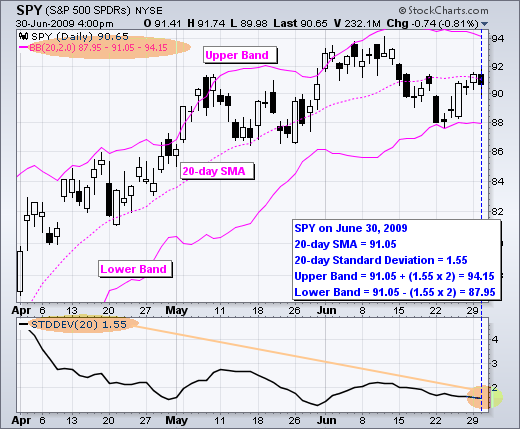
Bollinger Bands are a popular tool in technical analysis that helps you gauge how volatile a stock or security is. They consist of three lines: a middle band (which is a simple moving average) flanked by upper and lower bands.
Key Points:
- Volatility Measurement: Bollinger Bands widen during times of high volatility and contract when things calm down.
- Overbought/Oversold Levels: If the price nears the upper band, it might signal overbought conditions, while touching the lower band could indicate oversold conditions.
- Confirmation Tool: They work best when confirming signals from other analysis methods.
Understanding Bollinger Bands
- The Three Lines: The middle band is a simple moving average, with the upper and lower bands set a specific distance above and below this average.
- Standard Deviations: The distance between the bands is usually set at two standard deviations from the middle band.
- Customisation: Feel free to tweak the settings of Bollinger Bands to fit your trading style!
Trading with Bollinger Bands
- Trend Analysis: The direction of the middle band can tell you about the overall market trend.
- Breakouts: A breakout happens when the price moves beyond the bands, signaling a strong price movement.
- Trade Signals: When the price bounces off one of the bands, it might indicate a potential reversal or continuation of the trend.
Formula:
- Middle Band: 20-period simple moving average
- Upper Band: Middle Band + (Standard Deviation × 2)
- Lower Band: Middle Band - (Standard Deviation × 2)
Conclusion
There you have it—five powerful technical analysis techniques to enhance your trading strategy! Whether you’re utilizing Heikin Ashi to identify smoother trends, EMA for quick market reactions, RSI for momentum tracking, MACD for trend confirmation, or Bollinger Bands for volatility assessment, each tool adds a unique layer to your analysis.
By incorporating these techniques into your trading arsenal, you’ll be better equipped to make informed decisions and navigate the ever-changing markets with confidence. Happy trading!

