


As algorithmic traders, we've all been there. You backtest a strategy, see those beautiful profit curves, deploy it live, and then watch in confusion as the results diverge from what you expected. This disconnect between backtesting and live trading isn't just frustrating, it's one of the most critical challenges in algorithmic trading.
At AlgoBulls, where traders run strategies across backtesting, paper trading, and live environments, we see this question emerge constantly: "Why do my backtest results look so different from live performance?" The answer lies in understanding the technical layers, data complexities, and market realities that separate simulated environments from actual market execution.
Let's break down exactly what makes backtesting environments fundamentally different from live markets, and more importantly, how you can bridge that gap.
Understanding the Trading Environment Spectrum
Before diving into the technical factors, it's essential to understand where backtesting sits in the broader trading workflow:
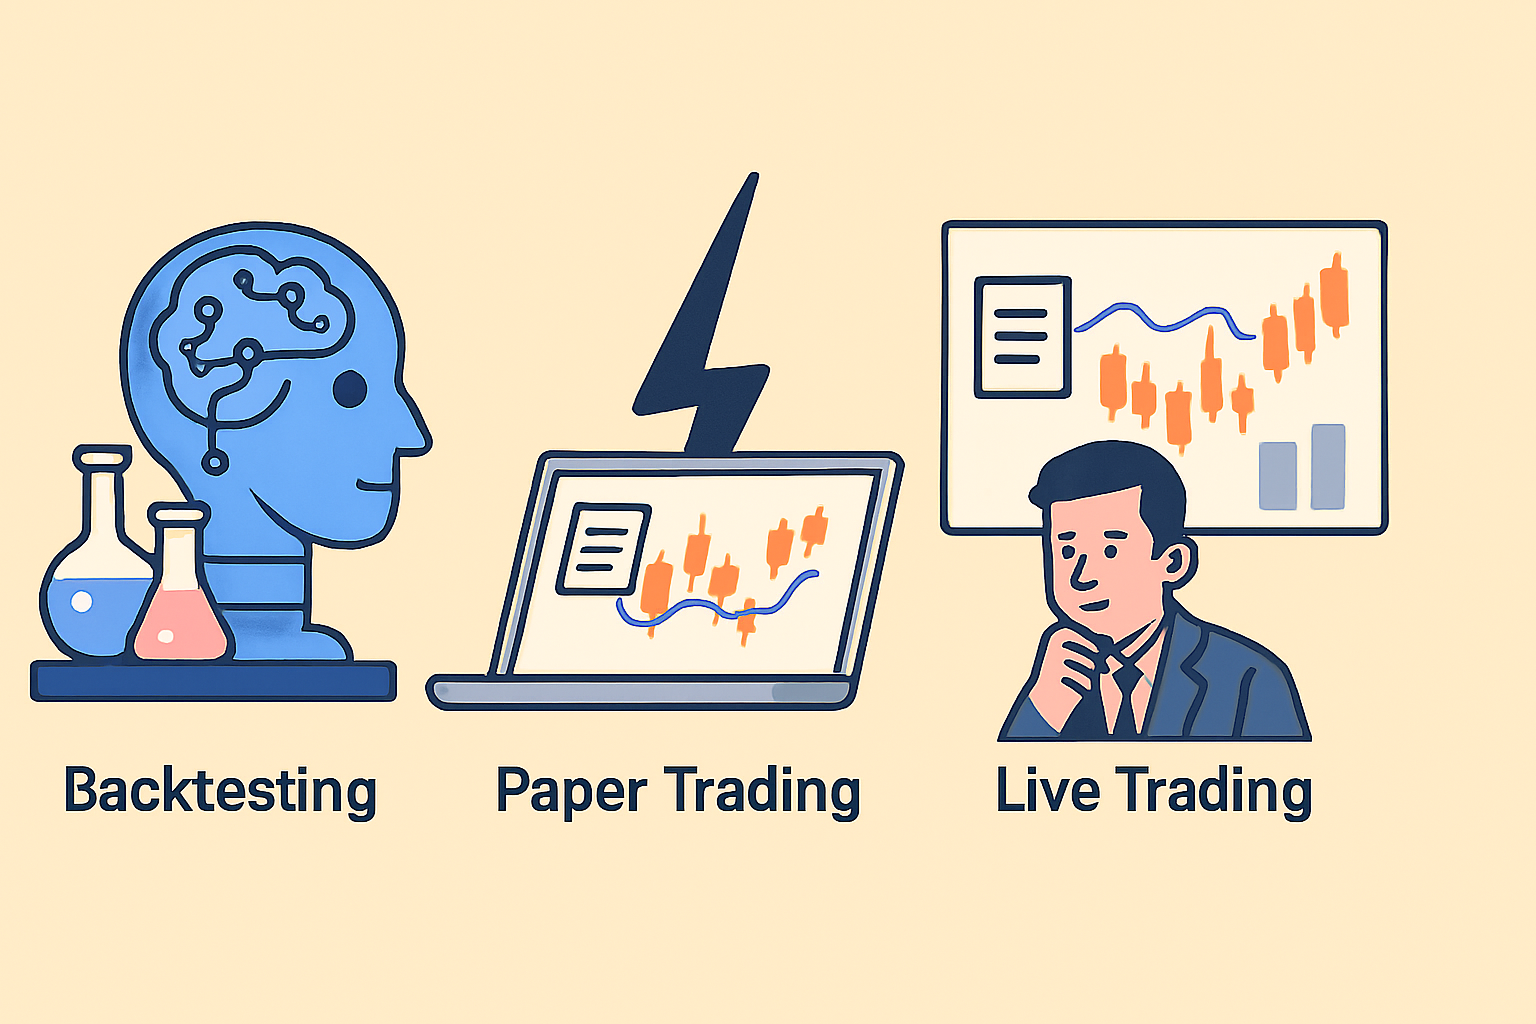
Backtesting is your laboratory environment. You're testing strategy logic against historical data to validate if your hypothesis has merit. Think of it as running experiments in controlled conditions, the data is frozen in time, and you have perfect hindsight.
Paper trading serves as your dress rehearsal. Your strategy executes against live market data in real-time, but without actual capital at risk. Orders are simulated, but the market conditions are real and unfolding.
Live trading is the actual performance. Real capital, real slippage, real market impact, and real emotions. This is where theory meets reality.
Each environment serves a purpose, but backtesting is where most traders start and where the most significant discrepancies often emerge.
The Data Layer: What You're Actually Testing Against
The foundation of any backtest is the data you use, and this is where the first major differences appear. Not all historical data is created equal, and the type of data you choose fundamentally shapes your backtest results.
Types of Historical Data Available for Backtesting
End-of-Day (EOD) Data
This is the most basic level, daily open, high, low, close, and volume. EOD data is clean, widely available, and computationally light. It's perfect for testing long-term positional strategies where intraday price movements don't matter.
However, EOD data hides everything that happens during the trading day. If your strategy involves intraday entries and exits, stop losses, or time-sensitive signals, EOD data will give you an incomplete picture. You won't see the intraday volatility that could have triggered your stops or the precise timing of breakouts.
Intraday Data (Minute/Second Bars)
Stepping up in granularity, intraday data gives you bars at various intervals, 1-minute, 5-minute, 15-minute, and so on. This allows you to test strategies that require intraday precision, like momentum scalping or mean reversion within trading sessions.
The challenge? Even minute-level data is an aggregation. A 1-minute bar shows you the open, high, low, and close for that minute, but not the sequence of trades within it. If your strategy depends on the exact order of price movements within that minute, say, a quick spike followed by a pullback the bar data might suggest your order filled when in reality, the price moved too fast.
Tick Data
This is the gold standard for backtesting accuracy, every single trade that occurred in the market, timestamped to the millisecond. Tick data captures the actual sequence of trades, the bid-ask spread at each moment, and the true market microstructure.
With tick data, you can simulate order book dynamics, understand how your orders would have interacted with actual market depth, and model slippage with far greater precision. The tradeoff? Tick data is massive in size, expensive to store and process, and requires significant computational resources to backtest. For a strategy trading actively over months or years, processing tick data can take hours or even days.
Order Book Data
Beyond just trade data, order book data shows the full market depth of all the buy and sell orders at various price levels. This allows you to model how your orders would have moved through the order book, estimate market impact, and understand liquidity at each price point.
This level of data is crucial for high-frequency strategies or large order execution, but it's also the most complex to work with. Not all data providers offer historical order book data, and the computational requirements are substantial.
Data Quality Issues That Create Backtesting Distortions
Even with the right type of data, quality issues can silently corrupt your backtest results:
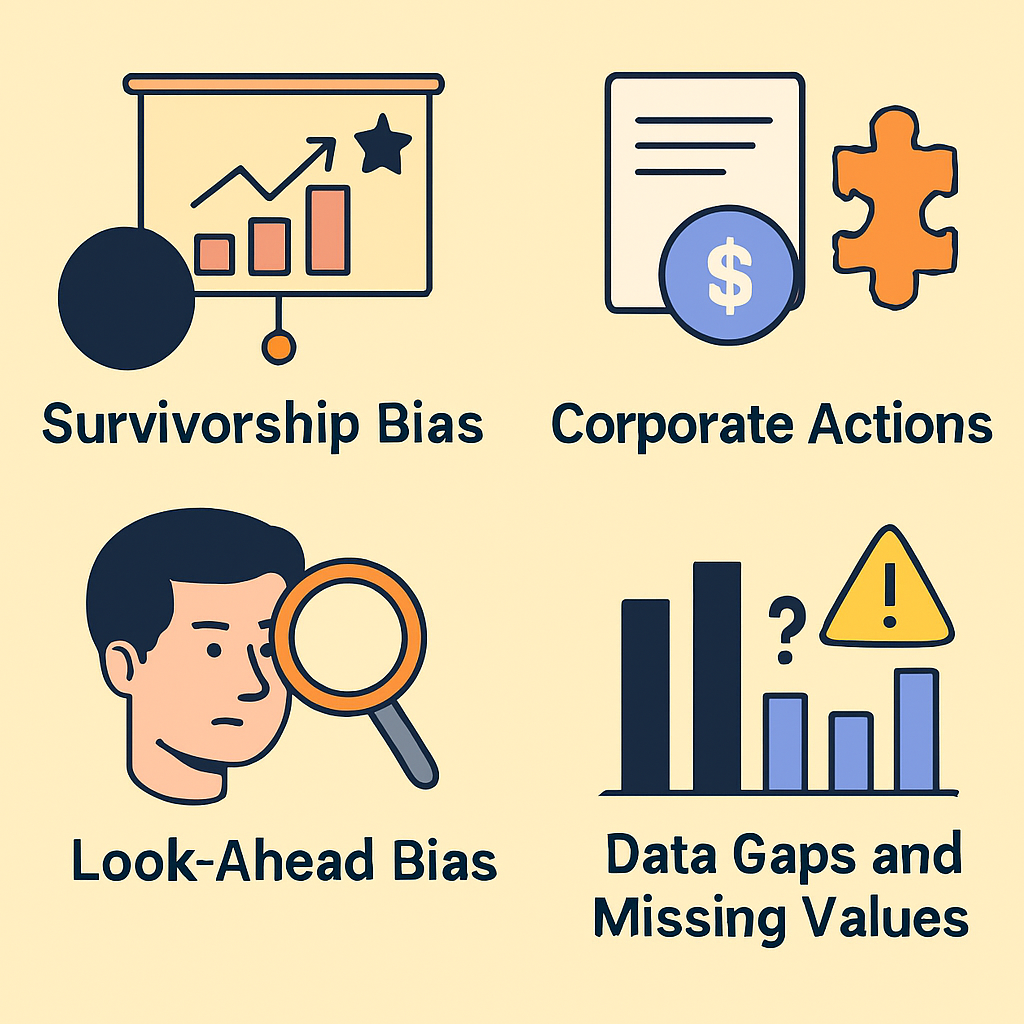
Survivorship Bias occurs when your dataset only includes assets that survived until the present day. If you're backtesting a stock selection strategy, and your data excludes companies that went bankrupt or were delisted, you're testing against an artificially successful universe. Your strategy will look better than it should because it never had to deal with the losing positions from failed companies.
Corporate Actions like splits, dividends, bonuses, and mergers need to be properly adjusted in historical data. If your data provider hasn't adjusted prices for a 2-for-1 stock split, your backtest might show a 50% overnight loss that never actually occurred. Dividend adjustments matter too strategies holding stocks through ex-dividend dates should reflect the dividend income, not just the price drop.
Look-Ahead Bias is particularly insidious. This happens when your backtest accidentally uses information that wouldn't have been available at that point in time. For example, using today's close price to make a decision at today's open, or using restated financial data instead of the originally reported figures. Your backtest performs well, but it's because you're subtly peeking into the future.
Data Gaps and Missing Values occur more frequently than you'd think, especially in less liquid instruments or during market disruptions. A missing data point might cause your backtest to skip a trade, hold a position longer, or make incorrect calculations. In live trading, you'd have to decide how to handle missing data in real-time. Your backtest should simulate that decision-making too.
The Execution Layer: Where Theory Meets Market Reality
Even with perfect data, the way your backtest simulates order execution creates significant differences from live markets.
Fill Assumptions and Order Types
In most basic backtesting systems, orders fill at the exact price you specify, or at the open/close of the next bar. This is a dramatic oversimplification.
Market Orders in backtesting typically assume you get filled at the current price. In reality, a market order fills at the best available price in the order book, which might be several ticks away from the last traded price, especially in fast-moving markets or illiquid instruments. Your backtest might show an entry at ₹100, but your live order could fill at ₹100.50 if that's where the available liquidity sits.
Limit Orders introduce even more complexity. Your backtest might assume that if the price touches your limit, you're filled. But in live markets, there's a queue. If 10,000 shares are offered at ₹100 and your limit buy is for 100 shares, you're in line behind everyone else at that price. The price might touch ₹100 briefly, fill the first few orders in the queue, and then bounce back up leaving your order unfilled. Your backtest shows a successful entry; your live strategy shows a missed opportunity.
Stop Loss Orders are particularly tricky. In backtesting, when the price hits your stop, you assume you're out at that price. But stop losses become market orders when triggered. In a rapidly falling market, by the time your stop executes, the price could be significantly lower than your stop level, a phenomenon called "slippage through stops." During market crashes or volatile events, this can turn a controlled 2% loss into a 5% loss.
Slippage: The Hidden Tax on Every Trade
Slippage is the difference between the price you expect and the price you actually get. It's one of the largest contributors to the gap between backtest and live performance.
Bid-Ask Spread is the most basic form of slippage. When you buy, you pay the ask price. When you sell, you receive the bid price. The spread between them is your cost. In liquid stocks, this might be just a few paise, but in less liquid instruments, spreads can be substantial. If your backtest uses mid-prices (the average of bid and ask) without accounting for spreads, you're overestimating your returns on every trade.
Market Impact becomes significant as your order size grows. When you place a large buy order, you consume the available liquidity at the best ask price, then at the next price level, and so on. Your order literally moves the market against you. A backtest might assume you can buy 10,000 shares at ₹100, but in reality, you might get 3,000 at ₹100, 4,000 at ₹100.20, and 3,000 at ₹100.40, resulting in an average fill price of ₹100.20.
Volume Constraints mean you can't always trade the size you want. If your backtest shows buying 5,000 shares but the actual traded volume that day was only 2,000 shares, your live order simply can't fill at any reasonable price without moving the market dramatically. Your backtest needs to check if your order size is realistic given historical volume; a common rule of thumb is not exceeding 5-10% of average daily volume.
Timing Latency between signal generation and order execution creates another form of slippage. In backtesting, the moment your signal triggers, you're filled. In live markets, there's network latency, broker processing time, and exchange queuing. Even with low-latency systems, prices can move in those milliseconds. For high-frequency strategies, this latency can completely eliminate an edge. For swing trading strategies, it matters less, but it still introduces noise between expected and actual fills.
The Cost Layer: Fees and Charges That Erode Returns
Transaction costs are often oversimplified in backtesting, yet they can transform a profitable strategy into a losing one, especially for high-frequency approaches.
Brokerage and Exchange Fees vary by broker, by exchange, by order type, and by your trading volume tier. Your backtest might use a simple fixed cost per trade say ₹20 per order. But in reality, you might pay different rates for equity versus F&O, different charges for intraday versus delivery, turnover charges, GST on brokerage, SEBI charges, stamp duty, and more. These costs add up, and they're not linear. At AlgoBulls, traders often discover their strategy's profitability is highly sensitive to the exact cost structure of their chosen broker.
Taxes introduce another layer. Short-term capital gains, long-term capital gains, STT (Securities Transaction Tax), and other tax implications affect your net returns. While taxes don't happen per trade, they impact your annual returns and should be factored into your strategy evaluation, especially for tax-loss harvesting strategies or strategies that trade across fiscal years.
Financing Costs matter for leveraged strategies or overnight positions. If you're using margin or carrying positions overnight, you're paying interest on borrowed capital. This cost can be substantial for highly leveraged intraday strategies or for portfolios that hold positions over weeks and months.
The Market Microstructure Layer: Dynamics You Can't Easily Simulate
Beyond data and execution, live markets have structural characteristics that are extremely difficult to replicate in backtesting.
Liquidity Dynamics
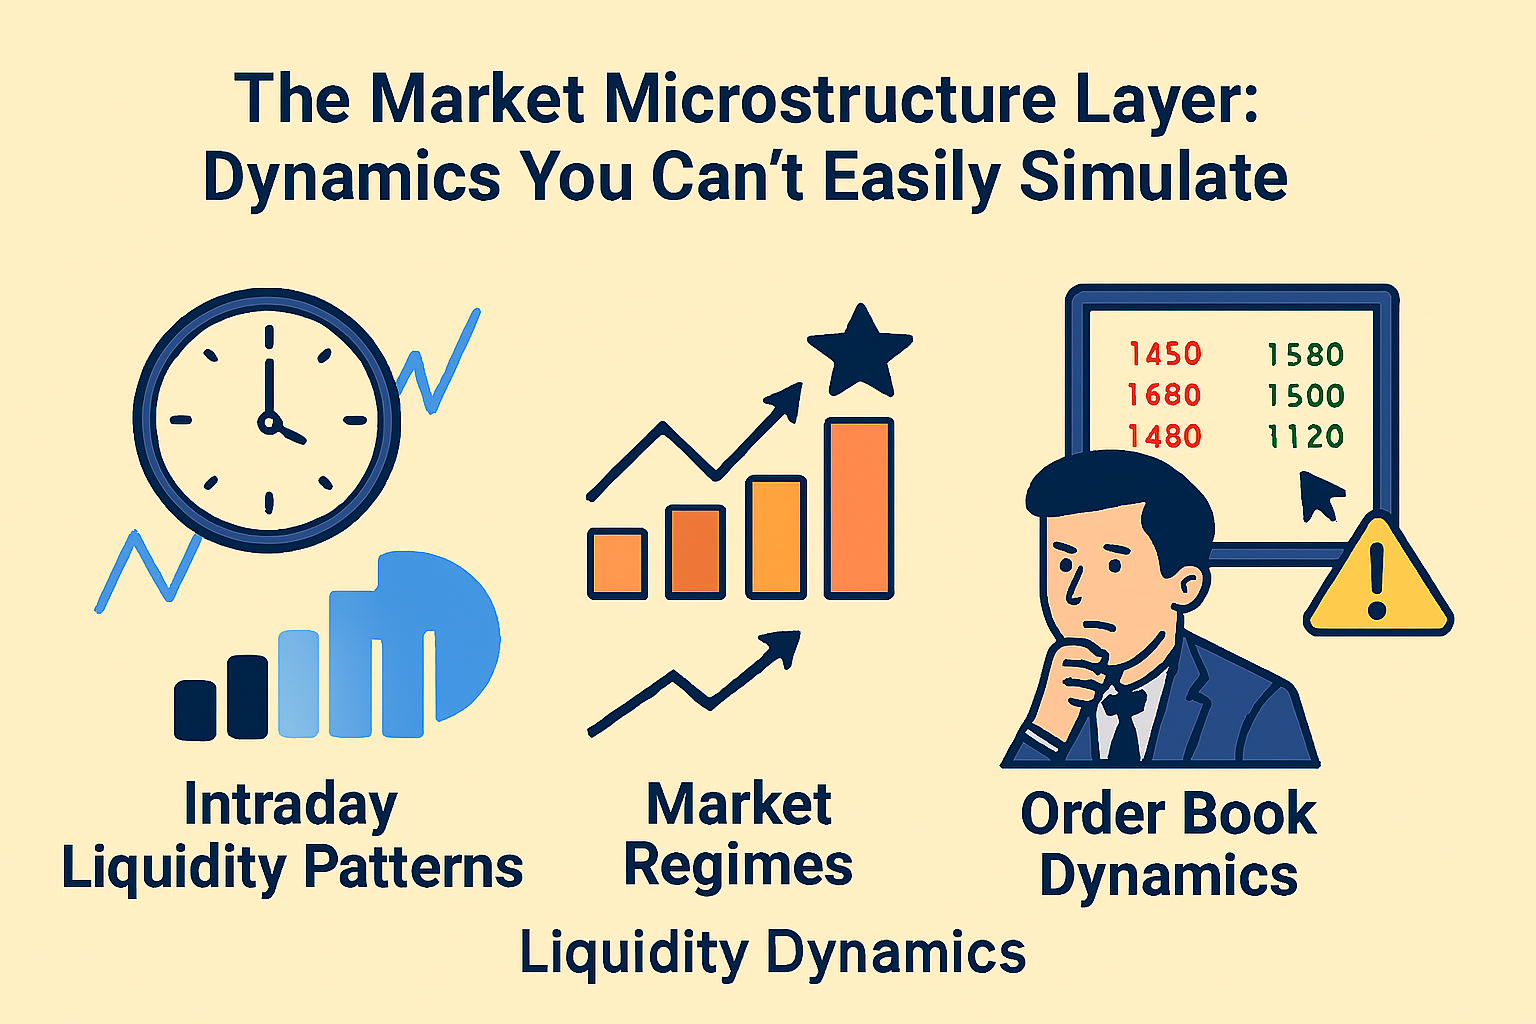
Intraday Liquidity Patterns change throughout the trading session. Markets are typically most liquid at the open and close, with a mid-day lull. A strategy that trades at 10 AM might find ample liquidity, while the same strategy trading at 1 PM might struggle to fill orders without significant slippage. Your backtest using daily or even hourly data might completely miss this pattern.
Market Regimes shift over time. A strategy backtested through a trending bull market will look great, but how does it perform in choppy, range-bound conditions or during bear markets? Historical backtests can't fully capture how markets structurally change shifts in volatility regimes, changes in correlation patterns, or new market participants (like the explosion of retail trading or algorithmic trading itself) that alter market dynamics.
Order Book Dynamics are constantly changing. The depth at various price levels, the rate at which orders enter and exit the book, and the presence of large hidden orders all affect execution. Your market order that would have filled at one price might get a different fill a second later as the book reshapes. Backtesting with simple historical price data can't capture this dynamic complexity.
External Shocks and Black Swan Events
News and Corporate Announcements create sudden volatility and liquidity changes that are hard to model. Earnings surprises, regulatory announcements, geopolitical events can cause dramatic price moves and gaps. Your backtest might show a stop loss at ₹95, but if the stock opens gap-down at ₹85 due to overnight news, that's where you exit. Circuit breakers, trading halts, and price limits further complicate execution during extreme events.
Flash Crashes and Volatility Spikes represent tail-risk events that occur more frequently than traditional models predict. A strategy that looks robust in backtesting might completely fail during a flash crash when liquidity evaporates and correlations go to one. Your backtest would need to specifically include such historical episodes and stress test how your strategy behaves.
The Behavioral and Technical Reality Layer
Execution Infrastructure
In backtesting, orders execute instantly and reliably. In live trading, you're dependent on your internet connection, your broker's uptime, exchange connectivity, and system stability. API rate limits might throttle your orders during peak volatility. Server outages might prevent you from entering or exiting positions. Your strategy needs to be resilient to these technical realities.
Partial Fills occur when your order is too large for available liquidity, and you only get a portion of your desired position. Your backtest might assume you enter with 1,000 shares, but you only get filled for 400. Do you chase the remaining 600 shares at worse prices, or do you trade with a smaller position? These decisions matter, and they're messy to model.
Order Rejections happen for various reasons: insufficient margin, risk management limits, exceeding position limits, incorrect order parameters. Your backtest assumes every order goes through, but live trading means handling rejection scenarios gracefully.
Psychological and Real-Time Decision Making
This is the hardest factor to quantify. Backtesting is emotionally neutral; you follow the rules mechanically. Live trading involves watching your capital fluctuate in real-time, managing the stress of losses, fighting the temptation to override your strategy, or dealing with the fear of pulling the plug during a drawdown.
Even the most disciplined traders experience psychological pressure that can cause them to deviate from their tested strategy. The strategy you backtested assumes you'll execute every trade with robotic precision, but human nature introduces variability that no backtest can fully account for (which is precisely why algorithmic execution through platforms like AlgoBulls can help reduce this behavioral risk).
Bridging the Gap: Making Backtests More Realistic
So how do you make your backtesting environment closer to live market reality?
Use Higher Quality Data: Whenever possible, use the most granular data you can afford and process. Tick data gives you the most realistic simulation. At minimum, use intraday data for any strategy that trades intraday.
Implement Realistic Slippage Models: Don't assume perfect fills. Add bid-ask spreads based on instrument liquidity. Model market impact based on your order size relative to volume. Including a slippage buffermany traders use 0.05% to 0.1% per trade as a conservative estimate, though this varies widely by instrument.
Account for All Costs: Include every fee your broker charges, not just a simplified cost per trade. Factor in taxes. Include financing costs if you're using leverage.
Validate Against Paper Trading: Before going live, run your strategy in paper trading mode using AlgoBulls' paper trading environment. This lets you see how it performs with live data, real-time latency, and actual order execution logic, without risking capital.
Stress Test with Different Market Conditions: Don't just backtest the recent bull run. Include bear markets, high volatility periods, and crisis events. Test how your strategy would have performed in 2008, 2020, or during flash crashes.
Use Walk-Forward Analysis: Instead of optimizing on the entire historical dataset, train your strategy on a period, test it on the next out-of-sample period, roll forward, and repeat. This simulates how your strategy would have performed if you had traded it in real-time, avoiding the optimization bias that comes from fitting perfectly to historical data.
Simulate Order Queue Dynamics: If using limit orders, don't assume automatic fills when price touches your limit. Model queue position and partial fills based on volume.
Be Conservative in Your Expectations: If your backtest shows 50% annual returns, assume live returns will be notably lower. Professional traders often expect live performance to be 60-70% of backtested results after accounting for all real-world factors. If your backtest is marginal, it will likely be unprofitable in live trading.
“These figures are illustrative and vary significantly based on strategy type, market conditions, liquidity, and execution quality. Past performance or backtested results do not guarantee future returns.”
The AlgoBulls Advantage: Testing Across All Three Environments
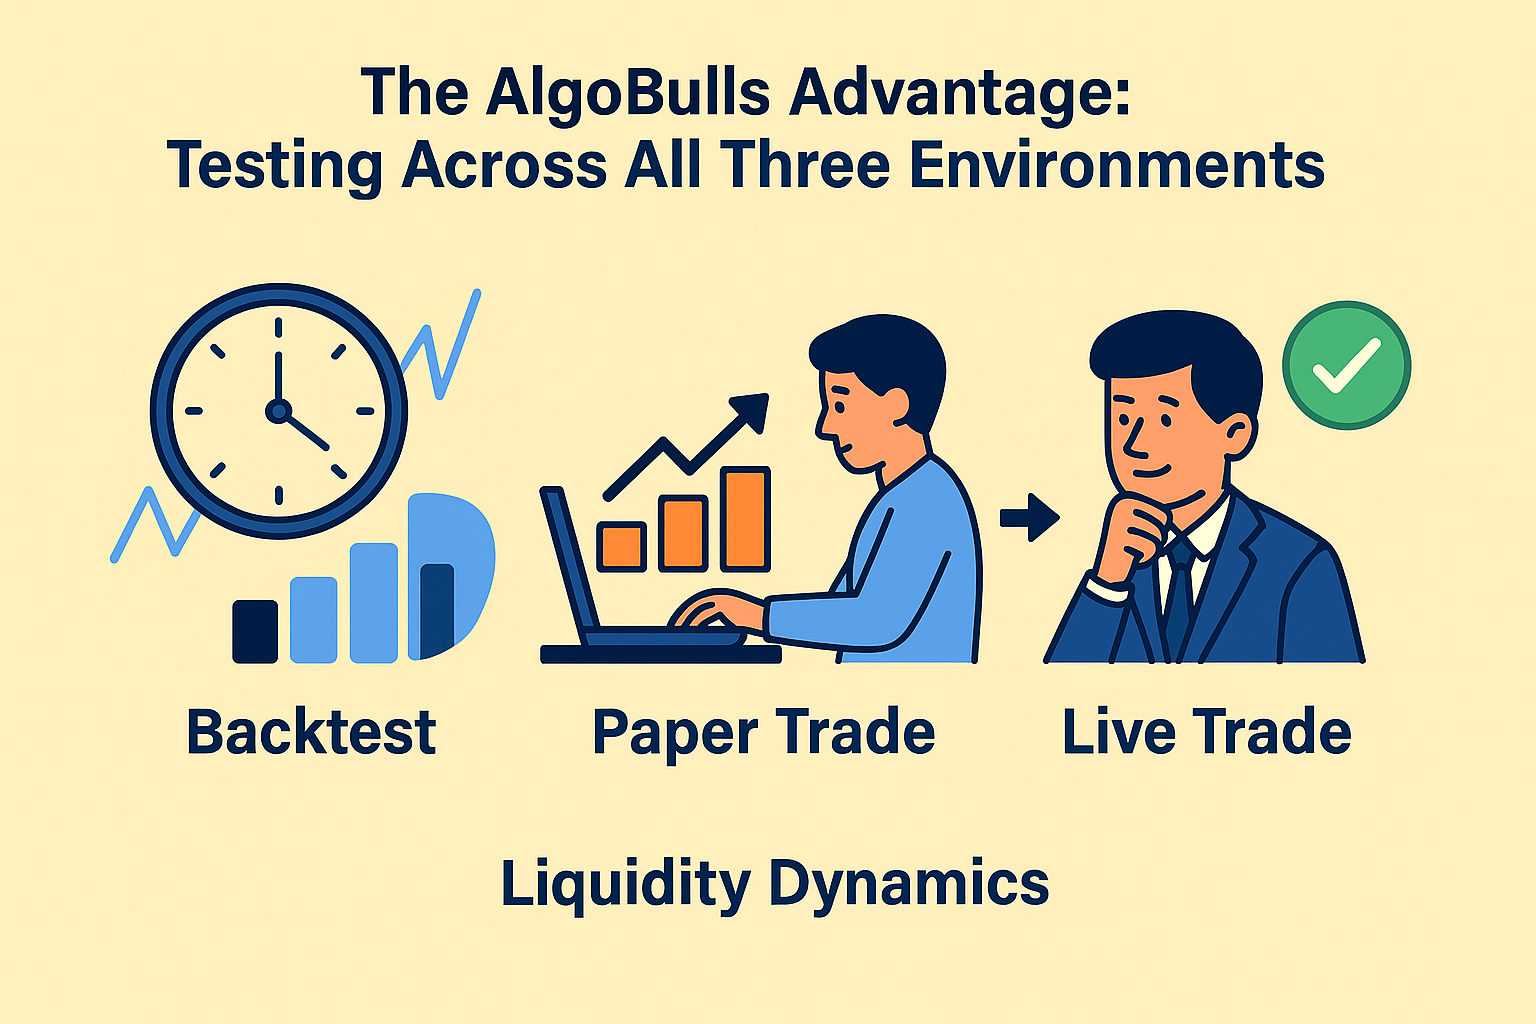
At AlgoBulls, we understand these challenges because we see them daily across thousands of strategies. Our platform allows you to seamlessly move from backtesting to paper trading to live trading without changing a single line of code. This continuity is crucial for understanding how your strategy's performance evolves across environments.
Whether you're using Phoenix Classic Build for visual strategy creation, Phoenix Python Build for custom code, or selecting strategies from Odyssey, every strategy (expect for Odyssey, those are only available in Live and Paper Trade) can be tested in all three modes:
Backtest with historical data to validate your core logic and optimize parameters.
Paper trade with live market data to see how your strategy handles real-time price movements, latency, and market conditions without risking capital.
Live trade when you're confident, knowing that the execution infrastructure, order handling, and broker integration are already tested through paper trading.
This progression allows you to identify and address the gaps between backtesting and live performance systematically, rather than discovering them the hard way with real money on the line.
Conclusion: Embrace the Reality, Respect the Limits
Backtesting is an invaluable tool, it's your first line of defense against bad ideas and helps you understand if your strategy has any merit. But it's not a crystal ball. The differences between backtesting environments and live markets are not bugs in the system, they're fundamental characteristics of how markets actually work.
The best algorithmic traders don't expect their backtests to perfectly predict live performance. Instead, they use backtesting to eliminate obviously bad strategies, then rely on paper trading to refine execution, and finally approach live trading with appropriate position sizing and risk management, knowing that some variance from backtest results is inevitable.
Understanding the technical factors, data granularity, execution assumptions, cost structures, market microstructure and behavioral realities helps you build more robust strategies and set realistic expectations. Your backtest is the starting point of strategy development, not the end point.
The gap between backtesting and live markets will always exist, but by understanding its causes and accounting for them systematically, you can narrow that gap and build strategies that not only look good on paper but actually perform in the real world.
Ready to test your strategies across backtesting, paper trading, and live environments? Start with AlgoBulls today and experience the full spectrum of algorithmic trading from hypothesis to execution all on one platform. Start your 7-day trial at ₹99 and see the difference for yourself.